Tags

Source: Sergey Vinagradov- Unsplash
Modern vaping theology venerates New Zealand’s “regulated vaping market model” as the way all nations should go if they want to reduce smoking. Its doctrinaire, excitable adherents feverishly point to unparalleled recent declines in smoking prevalence in all adults, in Māori adults (who smoke much more than the general population) and in youth. These declines are said to have followed the advent and rise in vaping and New Zealand’s Nov 2020 regulation of vapes which allowed them to be legally sold from dedicated vape stores and ‘dairies’(small, owner-operated convenience stores selling groceries, milk and other essentials, often outside of regular business hours).
As I noted in an earlier blog, the UK, USA and Canada also have highly liberal vape access policies (regulated market models) but comparable or higher smoking prevalence than Australia, which has far more restricted vape access legislation. Vaping advocates like to cherry pick New Zealand to provide a comparison with Australia compatible with their previous outspoken advocacy for regulated market models.
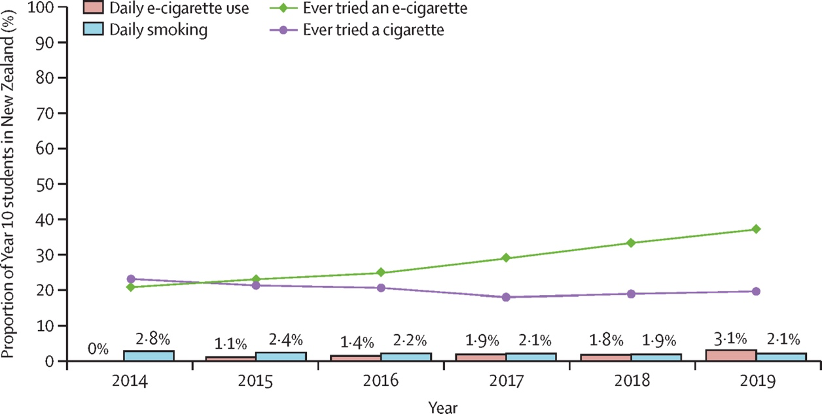
The evidence being used here is cross-sectional (ie: annual school surveys of around half of all New Zealand year 10 –14-15yo students) from 2014-2019.2015 was the first year that the survey asked questions about vaping frequency, enabling reporting on daily vaping. The graph below shows a 0.7% absolute decline and a 25% relative fall in daily smoking between 2014 and 2019, while daily vaping rose between 2015-2019 from 1.1% to 3.1% (2% absolute and 65% relative increases).
Every first semester biostats student has it drilled into them that cross-sectional data cannot be used to draw causal conclusions. When I edited Tobacco Control across 17 years, this criticism was probably that most commonly made by reviewers of papers which used post hoc ergo propter hoc (after therefore because of) reasoning with cross-sectional data. The 2020 paper’s authors were therefore wise to use “suggests …might” when they concluded “…overall decline in smoking over the past 6 years in New Zealand youth suggests that e-cigarettes might be displacing smoking”.
But many vaping advocates aren’t typically bothered by the sublimation of associations into causal language conclusions when it suits their agenda. An analysis of submissions to the New Zealand Parliament’s Health Select Committee considering a 2020 Bill which regulated the sale and marketing of e-cigarettes, found that the 2020 paper was the most frequently cited evidence used to try and influence the Committee, including by British American Tobacco. Those fervidly embracing the paper who are determined to preserve, strengthen and evangelically promote New Zealand’s experience internationally would have hardly complained if associations morphed into causes when the rubber met the road of political, media treatment and public understanding tests.
But , whoa! Hold the horses!
Sensing there were problems with the paper, Sam Egger from Cancer Council NSW led a paper that took a deeper dive into an expanded data set from 1999-2023 noting that the 2020 paper had only looked at 2014-2019 data and that 2014 was “years after vaping had established a notable presence in New Zealand. Importantly, the analysis did not assess whether smoking trends changed before and after shifts in vaping prevalence, an essential requirement for evaluating the population-level impacts of vaping on smoking.”
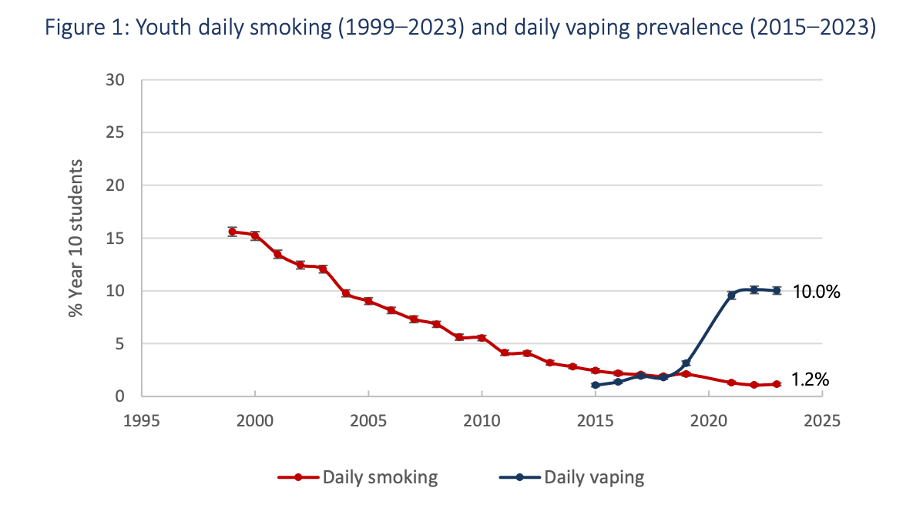
In other words, the 2020 paper had not considered the question of whether the remarkable decline in youth smoking which started well before the appearance and proliferation of vaping in youth (see chart below), accelerated with the arrival of vapes in about 2010 and then their rapid uptake after 2019 (with the latter, it of course could not have done this, having 2019 data as its endpoint).
This was a very basic omission, and one that amounted to seriously narrowing the evidence goalposts in the exercise of assessing vaping’s possible role in influencing trends in smoking by 14 and 15 year olds. The question about ever vaping was added to the school survey in 2014, with daily vaping added a year later. This start of these questions would not have been a capricious choice but one that almost certainly would have reflected common observational ‘knowledge’ of youth vaping increasing, perhaps over several years prior to 2014 when it was first counted. ASH, which is responsible for the annual surveys since 1999 (see graph below), clearly knew youth smoking had been in freefall since at least 1999 so that factors other than vaping were in play.
In their no stone unturned paper using interrupted time series analysis they concluded “In stark contrast to the conclusion of the previous study, we found that among 14-15 year-olds, the emergence and rapid rise in vaping in New Zealand may have slowed the rates if decline in ever- and regular smoking, while having little or no impact on the rate of decline in daily smoking.”
In a commentary in The Conversation, they noted “the rates of decline in ‘ever smoking’ and ‘smoking regularly’ slowed significantly from 2010 onwards, coinciding with the emergence of vaping in New Zealand. The rate of decline in daily smoking did not change significantly from 2010 onwards.
In 2023, about 12.6% of 14 and 15-year-olds in New Zealand had ‘ever smoked’ (ranging from just a few puffs to smoking daily). However, if the ‘ever smoking’ rate had continued along its pre-2010 trajectory (before vaping emerged) this figure would have been 6.6%.”
So there was now plenty of heat in this particular data analytic kitchen. But then a blowtorch arrived with an apparently blistering critique of what the Egger authors had done. Four authors from the University of Queensland gave the Egger group both barrels with a three point shellacking that essentially went “here’s what you did, and here’s what you should have done … so your conclusions are unsound”. Read it all in the link.
But channelling Crocodile Dundee (“THAT’s not a knife … THIS is a knife”) the Egger group then rapidly returned serve, eviscerating the Queensland group’s critique point-by-point. Again, read it for yourself.
All this will have been read by a small number of people who closely follow these debates. And will have been understood by an even smaller number who are highly trained in analysis of trend data.
But one thing is absolutely certain, the veteran nag confirmation bias will yet again get a good run around the block. Those who like the conclusions of the 2020 paper will keep megaphoning them without mentioning the Egger group’s very contrasting findings. Criminologists have a term for this: the ‘woozle effect’ where studies with flawed conclusions that have been discredited continue to be referenced, as though those conclusions still offer credible evidence.
I published a paper in 2009 on citation bias, which is the selective citation of published results to support the findings, arguments or interests of authors and those funding their work. Our paper showed that a very old (1982) and small study (n=24) showing extremely high smoking prevalence in people with schizophrenia (88%), had been massively cited in preference to many more recent and larger studies which showed far lower smoking by those with schizophrenia. News media commonly referred to smoking rates in those with schizophrenia as “as high as 90%” when a meta-analysis of 42 studies found average smoking prevalence to be 62%, much higher than the general population but nowhere near 90%.